






Support & helpStatus & self-help
Network status, maintenance and announcements
Check the HyperDC network status page for incidents and planned maintenance, read component uptime, subscribe to status feeds and follow our announcements.
- Beginner
- 5 min read
- Updated
Tested on: HyperDC client area
On this page
Before you open a ticket about an outage, check whether we already know about it. The Network Status page lists current incidents, planned maintenance and the state of our platform, and Announcements carries news about changes. This guide shows how to read both and how to subscribe to updates.
Open the network status page
You can reach it from several places:
- In the client area, Support › Network Status in the left menu, or the Network Status link with the coloured dot at the bottom of the menu.
- On the dashboard, the status card next to the welcome text, for example All systems operational or We are investigating an issue, with Scheduled maintenance: and the number of planned works when there are any.
- On our website, the Network Status link in the footer.
Step 1: Read the overall state
The banner at the top sums up the platform: All systems operational, Maintenance in progress, Degraded performance, Partial outage or Major outage, with a short explanation underneath.
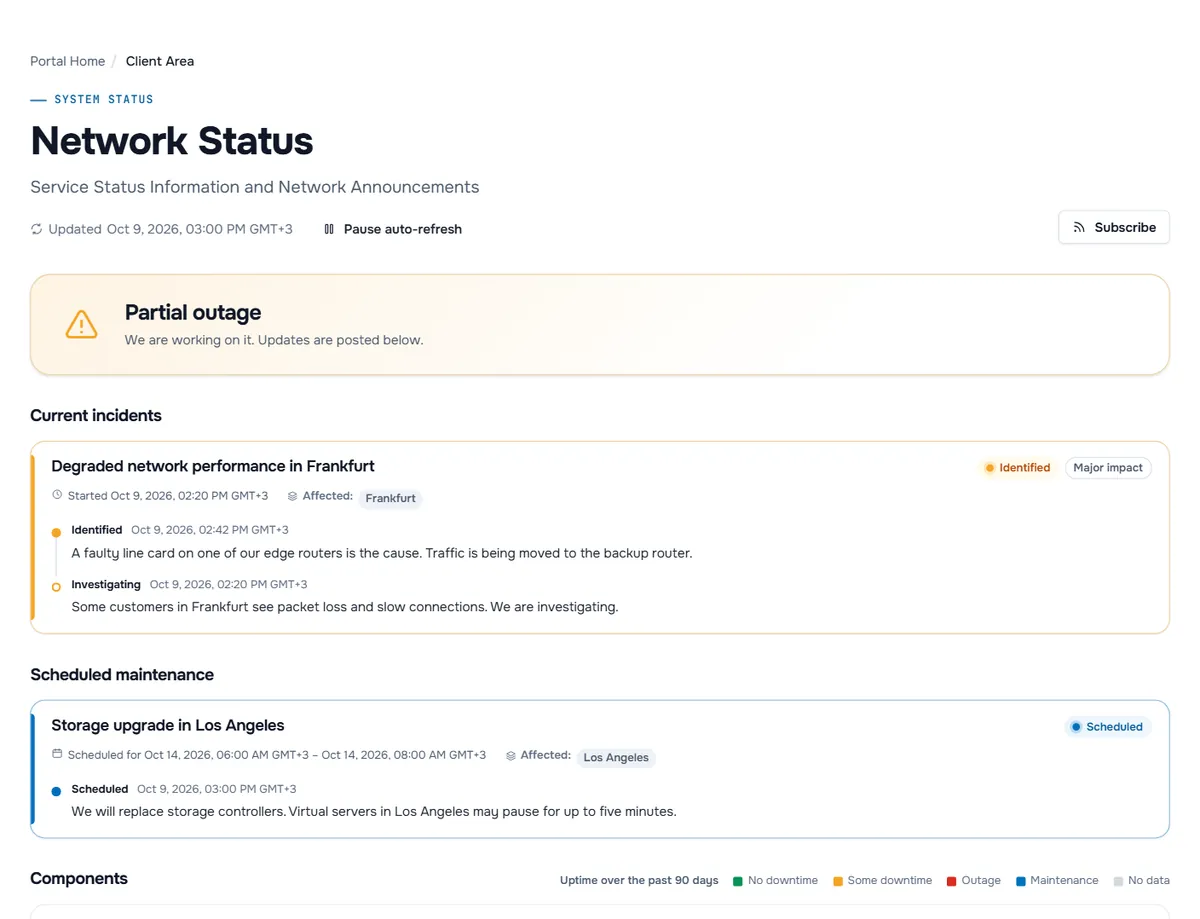
Next to Updated you see when the page was last refreshed. The page updates itself; select Pause auto-refresh while you read, and Resume auto-refresh to continue. When new information arrives, This page has new updates. appears with a Reload button.
Step 2: Follow incidents and maintenance
- Current incidents lists open problems. Each card shows a title, its stage (Investigating, Identified, Monitoring or Resolved), the impact (for example Major impact), when it Started and which components are Affected. The updates below run from the newest to the oldest.
- Scheduled maintenance lists planned work with Scheduled for start and end time, the affected components and its stage (Scheduled, In progress, Completed). While work is running, the heading reads Maintenance in progress.
Times are shown in your browser's time zone.
Step 3: Check components and past incidents
Under Components, each part of our platform shows its state: Operational, Under maintenance, Degraded performance, Partial outage or Major outage. Groups of components open with a click.
If the page shows uptime bars, the legend above them says how many days they cover (Uptime over the past … days). Each bar is one day: No downtime, Some downtime, Outage, Maintenance or No data. Hover over a bar, or focus it and use the arrow keys, to see that day's uptime and incidents. Some components also show their Response time over the Past 24 hours.
Past incidents lists the recent days, with No incidents reported. for quiet days. Select Show all … updates on an incident to read its full timeline, and Earlier incidents for older months.
Step 4: Subscribe to updates
Select Subscribe at the top right. The menu Get status updates offers the feeds that are available, such as an RSS feed, an Atom feed, a Maintenance calendar (iCal) for your calendar app, JSON for bots and integrations and Network issues (RSS). Copy the link into your feed reader, calendar or monitoring tool.
Step 5: Read the announcements
Open Support › Announcements. The page Announcements shows the newest post first with a Latest label (or a post marked Featured), then More updates. Select Continue reading to open a post.
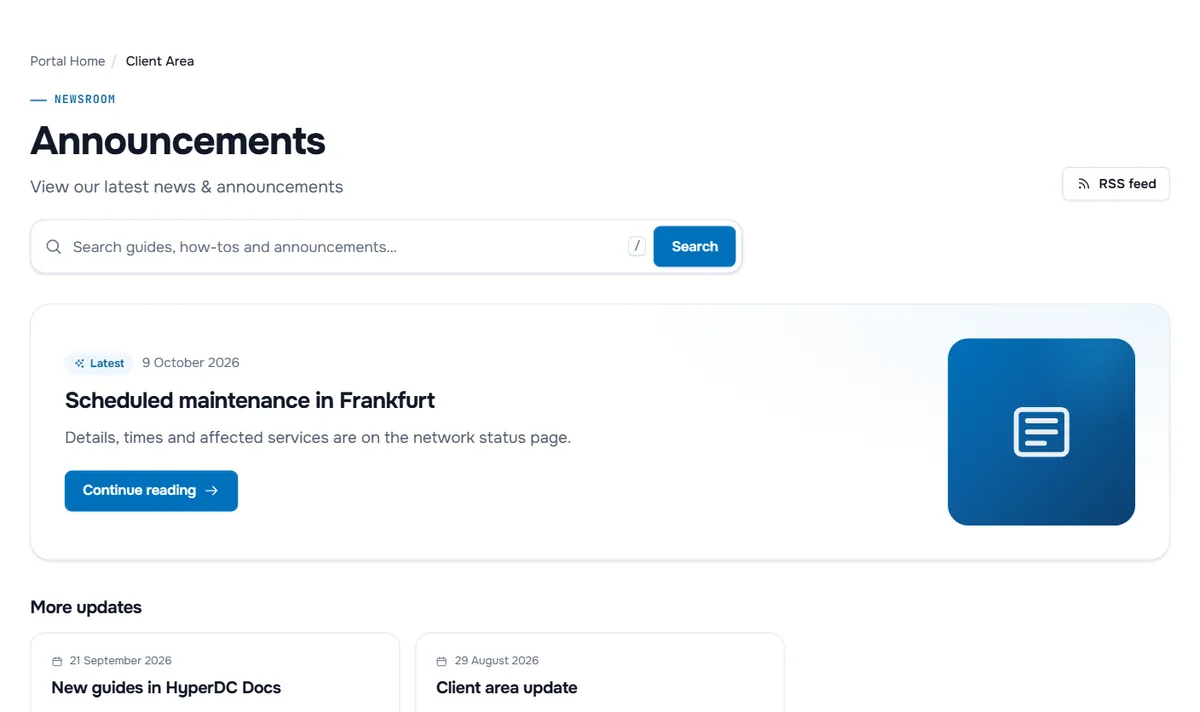
- The search field at the top searches our knowledgebase and announcements.
- RSS feed subscribes you to new posts.
- If the page shows an Archive, use the year buttons to list older posts.
Troubleshooting
My service is down but the page shows All systems operational. The page covers our network and platform, not the inside of a single server. Work through server unreachable, then open a support ticket with your measurements.
The page does not change during an incident. Check whether auto-refresh is paused, or reload the page.
The times look wrong. They follow your browser's time zone. Check the date and time settings of your device.
Next steps
- Diagnose your own server: server unreachable.
- Report a problem that is not listed: open a support ticket.
- Find answers yourself: search the guides and help.
Frequently asked questions
My server is down but the status page says everything works. Why?
The status page reports incidents on our network and platform. A problem inside one server, such as a firewall rule, a full disk or a stopped service, does not appear there. Follow the server unreachable guide and open a ticket if the server stays down.
In which time zone are the times shown?
Incident and maintenance times on the status page are shown in the time zone of your browser.
How do I get told about maintenance without checking the page?
Use Subscribe on the status page. Depending on what is offered, you can follow an RSS or Atom feed or add the maintenance calendar to your calendar app. Announcements have their own RSS feed.
Do I need to open a ticket during a listed incident?
Usually not: follow the updates on the status page. Open a ticket if your service is affected in a way the incident does not describe, or if it is still not working after the incident is resolved.